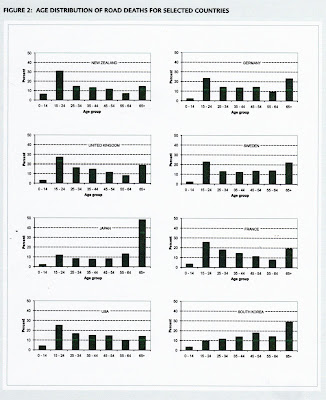
The first shows how NZ compares to other countries in deaths per 10,000 vehicles. Not too badly;

The second shows the growing vehicle fleet and casualties compared to 1990. Not too bad;

The third shows the number of 15 to 19 year-olds involved in fatal crashes. Not good but generally going in the right direction;

The fourth shows the age distribution of road deaths for selected countries which shows NZ has a high proportion clustered in the young age group. Important point here is that those deaths include passengers. In the year to end January 2010 47 15-24 year old drivers were killed but so were 49 15-24 year-old passengers. This is the only age group which has this kind of pattern. In every other age group (bar 45-54) the ratio is around 3 drivers killed to 1 passenger.
Note on this page the completely different profile for Japan and South Korea. South Korea, which has a much higher road toll than NZ has its problem heavily clustered at the other end of the age spectrum.

Finally I had a look at NSW where the driving age is 17. What difference does it make?
People under 26 are involved in 36 percent of road fatalities.
Here people under 25 are involved in 28 percent of road fatalities (111 deaths out of 391 to the end of Jan 2010.)
(The NZ statistic includes one extra year.)
In NSW the clamouring is to raise the driving age to 18 because 17 year-olds are killing themselves and their mates on the road.

2 comments:
Many things contribute to the much lower injury and death statistics despite the huge increase in vehicle numbers.
Much better tyres, suspension, weight and weight distribution, lower centre of gravity, visibility, and all round better handling.
Safety belts, airbags, side-intrusion protection, crumple zones, all round better engineering.
Much better highways, better gripping road surfaces, cambering, shoulders, width, visibility, lighting and reflectors at night, passing lanes, median barriers, multi lanes, motorways, better engineering all round.
Vehicles all better able to maintain highway speeds, reducing driver impatience.
For learner drivers it is much more difficult than when I learnt to drive a long time ago. Far more distractions inside the car, more instruments, radios, cds, dvds, and more congestion outside the car where there are lots of things happening at once, and happening quite quickly. Taffic moving quicker, closer together, the need to anticipate lane changes, gaps in traffic closing quickly, watching for signals (if given!), off ramps leading to congested roundabouts, all happening rapidly. Around the cities, getting straight into congestion at 100kph first thing in the morning is no picnic.
I am not surprised by the overall improvement, nor am I surprised at the statistics running against the younger drivers. I would not want to be in their shoes learning to drive in what is a far more hostile environment than when I was at that age.
Incidently, I drive big mileage in other countries. The Auckland motorway is the most constantly congested piece of roadway that I have to drive on anywhere.
kurt
A comment on the first chart. The worst country (Hungary) has a zero drink drive limit. Even if you have a small residual amount of alcohol in the blood or breath, you get a fine.
Post a Comment